Population: 127.6 million
Density:336 per SQ km
NEt migration Rate: 350/1000
Birth Rate: 8.07/1000
Death Rate: 9.38/1000
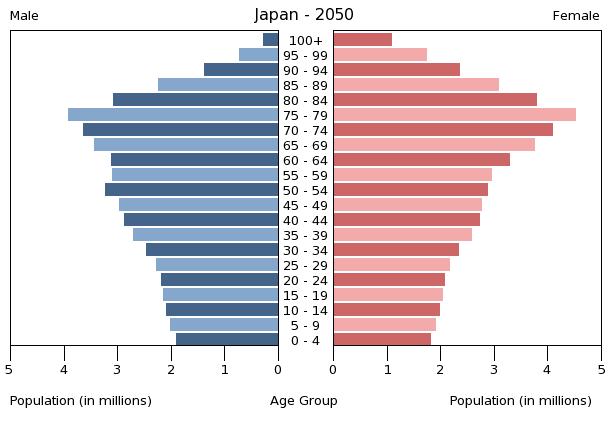
Rate of Natural Increase: -1.73%
Population Growth Rate: -0.25%
Infant mortality rate: 2.08/1000
Total fertility rate: 1.41 per female
population <15%: 13%
Population Ages 65+: 26%
DEPENDENCY RATE: 42%
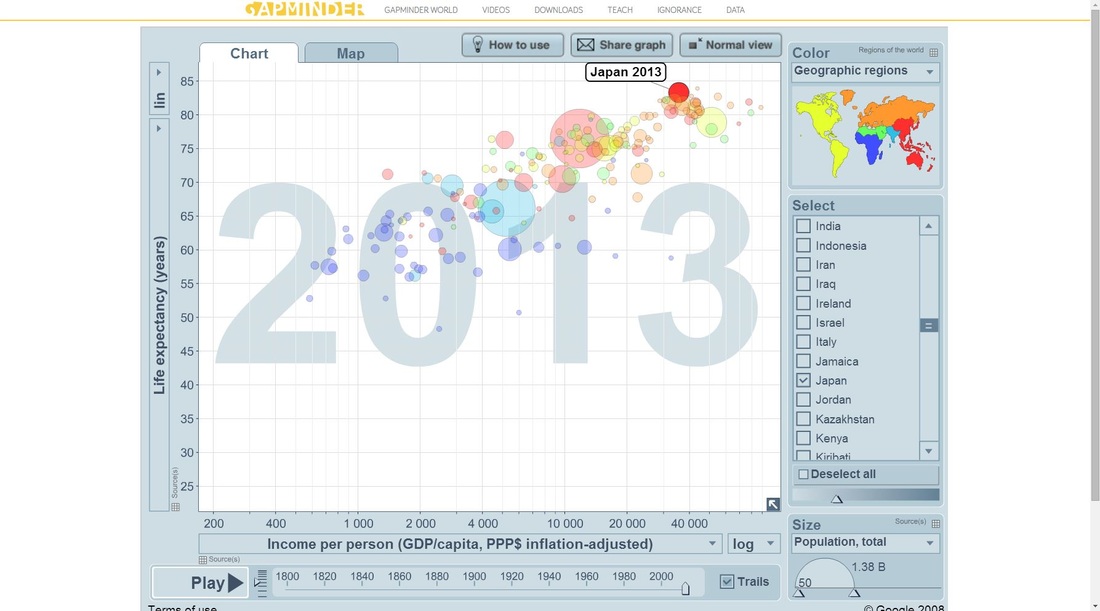
LIFE EXPECTANCY AT BIRTH(TOTAL): 83.1 Years
LIFE EXPECTANCY AT BIRTH FEMALES: 87.2 years
LIFE EXPECTANCY AT BIRTH MALES: 80.2 years
PRIMARY SCHOOL COMPLETION RATE FEMALES: 101.9%
PRIMARY SCHOOL COMPLETION RATE MAles: 101.9%
SECONDARY SCHOOL ENROLLMENT NET FEMALES: 102%
SECONDARY SCHOOL ENROLLMENT NET MALES: 102%
GNI PPP per CApita in US$: $37, 920
ECONOMICALLY ACTIVE FEMALE 15+: 72%
ECONOMICALLY ACTIVE MALES 15+: 48%
MOBILE PHONE SUBSCRIBERS: 120 SUBSCRIBERS PER 100
MOTOR VEHICLES: 588 MOTOR vehicles per 1000 people
UNDERNOURISHED POPULATION: N/a
UNDERWEIGHT CHILDREN UNDER AGE 5: N/a
HIV/AIDS AMONG 15-49: <0.1%
|
|
|
|
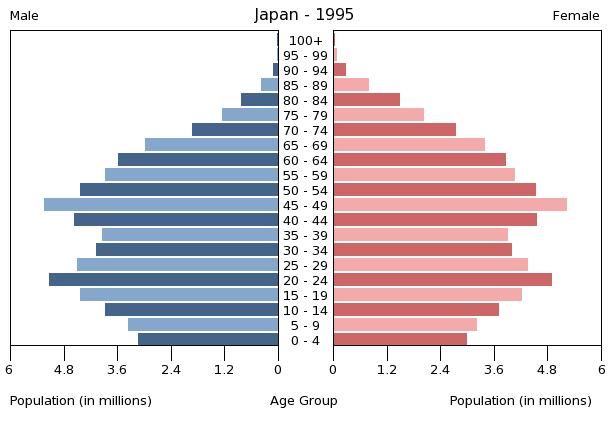
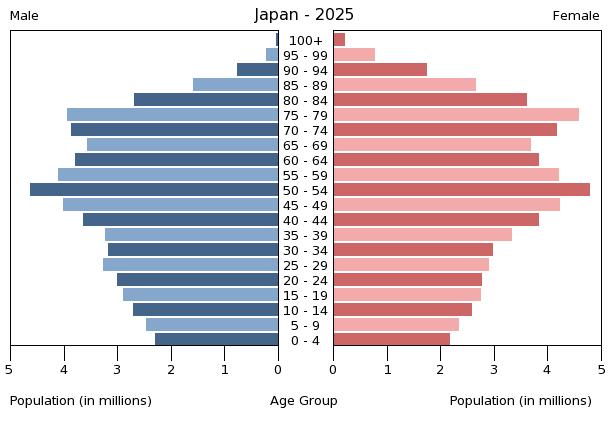
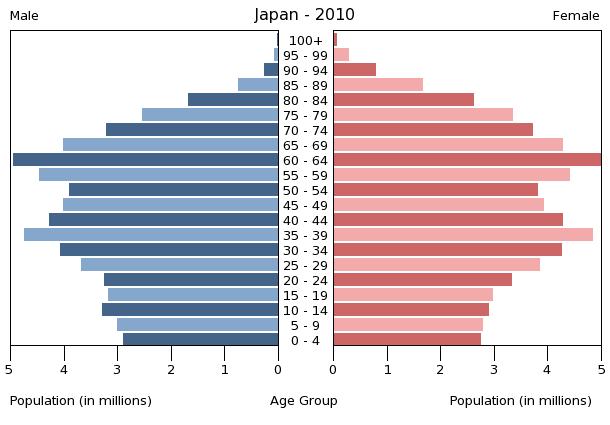
I Identify japan in stage 5 in demographic transition. japan is in stage 5 due to irregular death rates and declining birth rates. The elderly within japan highly outranks the amount of youth. In addition, japan has become quite hesitant to eager migrants in order to preserve a whole japan nationality.